Address
Email address
Phone number
Website
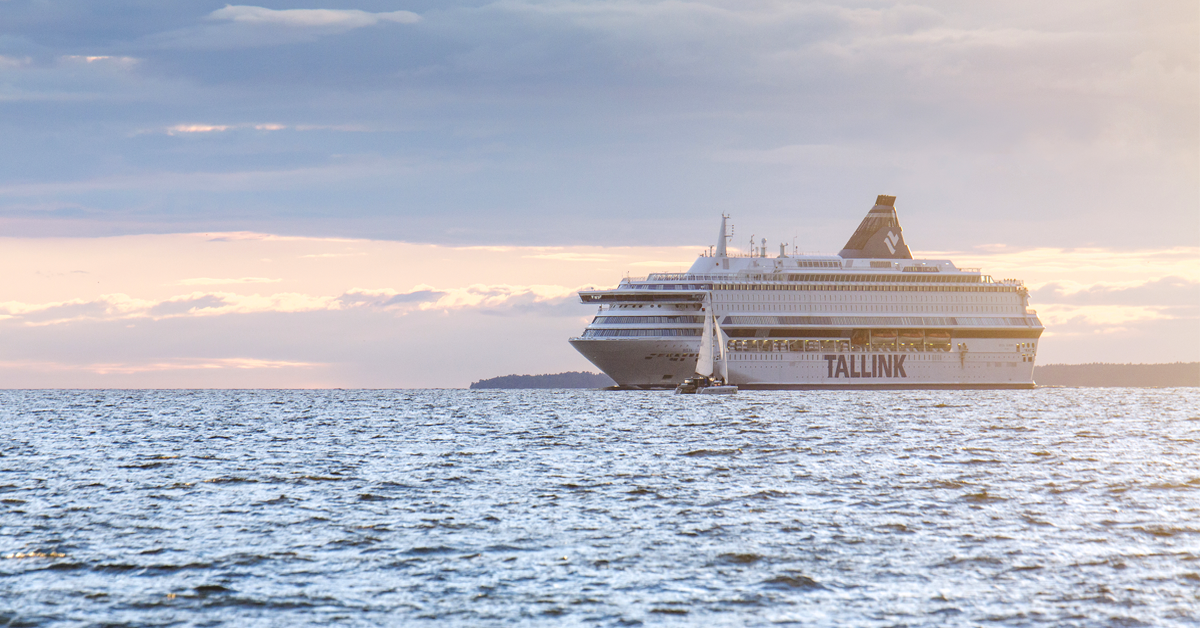 https://www.tallink.comThe nicest way to travel across the Baltic Sea - Tallink Silja Line
Let our ferries, cruise or cargo ships take you comfortably to Helsinki, Stockholm, Tallinn, Turku, Kapellskär, Paldiski or Åland. Book your trip today!
Name
Aktsiaselts Tallink Duty Free
Registry code
10179520
VAT number
EE100220641
Type
AS - Joint Stock Company
Status
Registered
Foundation date
10.01.1997 (27)
Financial year
01.01-31.12
Capital
25 560.00 €
Activity
46391 - Non-specialised wholesale of food, beverages and tobacco 47111 - Retail sale in non-specialised stores with food, beverages or tobacco predominating
101 803 729 €
347 811 €
0%
-
10 884 539 €
142
Submitted
No tax arrears
3%
1%
| Owner | Representative | Beneficial owner | Roles | |
|---|---|---|---|---|
| Aktsiaselts Tallink Grupp 10238429 | 100% - 25 560.00 EUR | - | - | Shareholder |
| Aimar Pärna 04.01.1963 (61) | - | Board member | - | |
| Enn Pant 26.06.1965 (58) | - | - | Member of a higher management body, i.e. board member or supervisory board member | Founder |
| Paavo Nõgene 13.03.1980 (44) | - | - | Member of a higher management body, i.e. board member or supervisory board member | |
| Mare Puusaag 25.03.1956 (68) | - | - | - | Board member |
| Meelis Asi 23.10.1964 (59) | - | - | - | Board member |
| Taavi Tiivel 28.04.1977 (47) | - | - | - | Board member |
| 2020 14.04.2021 | 2021 13.04.2022 | 2022 24.05.2023 | |
|---|---|---|---|
| Total Revenue | 76 656 898 € | 78 387 294 € | 101 803 729 € |
| Net profit (loss) for the period | 245 657 € | 142 377 € | 347 811 € |
| Profit Margin | 0% | 0% | 0% |
| Current Assets | 21 530 196 € | 27 445 897 € | 33 751 376 € |
| Fixed Assets | 11 938 733 € | 10 302 396 € | 8 965 450 € |
| Total Assets | 33 468 929 € | 37 748 293 € | 42 716 826 € |
| Current Liabilities | 15 314 271 € | 21 238 502 € | 27 486 838 € |
| Non Current Liabilities | 7 760 307 € | 5 973 063 € | 4 345 449 € |
| Total Liabilities | 23 074 578 € | 27 211 565 € | 31 832 287 € |
| Share Capital | 25 560 € | 25 560 € | 25 560 € |
| Equity | 10 394 351 € | 10 536 728 € | 10 884 539 € |
| Employees | 170 | 107 | 142 |
| Turnover | State taxes | Labor taxes and payments | Employees | |
|---|---|---|---|---|
| 2023 Q4 | - | 5 066 573.68 € | 432 217.26 € | 147 |
| 2023 Q3 | - | 6 031 776.94 € | 451 751.52 € | 147 |
| 2023 Q2 | - | 5 303 416.14 € | 413 583.87 € | 153 |
| 2023 Q1 | - | 3 205 698.98 € | 434 070.56 € | 144 |
| 2022 Q4 | - | 3 447 370.55 € | 401 924.86 € | 163 |
| 2022 Q3 | - | 5 732 041.02 € | 410 039.31 € | 156 |
| 2022 Q2 | - | 4 879 295.67 € | 343 989.7 € | 170 |
| 2022 Q1 | - | 3 001 495.76 € | 338 366.7 € | 136 |
| 2021 Q4 | - | 5 721 305.52 € | 320 966.81 € | 119 |
| 2021 Q3 | - | 7 552 392.96 € | 275 115.1 € | 115 |
| 2021 Q2 | - | 1 338 719.11 € | 339 990.51 € | 128 |
| 2021 Q1 | - | 2 007 868.19 € | 412 363.81 € | 112 |
| 2020 Q4 | - | 3 797 329.96 € | 455 301.59 € | 114 |
| 2020 Q3 | - | 7 652 927.22 € | 300 701 € | 172 |
| 2020 Q2 | - | 448 367.58 € | 38 516.01 € | 165 |
| 2020 Q1 | - | 3 193 442.25 € | 483 094.78 € | 200 |


